

Customer Profitability and Cost to Serve: Which Customers Really Make You Money
Your largest customer may not be your most profitable one. It may not be profitable at all.
Gross margin looks only at price and product cost. It ignores everything that happens after the order: the number of small orders, the freight you absorbed, the returns, the special pricing, the rebates, the EDI chargebacks, and the time your team spends on the account. Those costs are real, and they vary enormously from customer to customer.
This guide explains cost to serve, how to calculate customer profitability with a worked example, how to segment customers by profitability, and what to do about the accounts that cost more than they earn.
Why Gross Margin Isn’t Enough
Two customers can buy the same products at the same margin and produce very different profit. One orders a full pallet twice a month, by EDI, and pays on time. The other places small orders every day by phone, demands free freight, returns a tenth of what it buys, and pays in 75 days. Gross margin says they are equal. They are not.
What Goes Into Cost to Serve
| Cost | What drives it |
|---|---|
| Order processing | Number of orders and how they arrive: phone, email, EDI, portal |
| Picking and handling | Number of order lines and shipments |
| Freight | Freight absorbed, small and partial shipments, expedites |
| Returns | Return rate and handling |
| Pricing and rebates | Special pricing, rebates, and allowances |
| Compliance | EDI requirements, labeling, and chargebacks |
| Sales and service time | Rep commissions and service effort |
| Payment | Payment terms and days to pay |
A Worked Example: Two Customers
Both customers buy $500,000 a year.
| Customer A | Customer B | |
|---|---|---|
| Gross margin | 25% = $125,000 | 20% = $100,000 |
| Orders per year | 600 small orders | 50 large orders |
| Order processing | 600 × $15 = $9,000 | 50 × $15 = $750 |
| Picking and handling | 600 × $12 = $7,200 | 50 × $30 = $1,500 |
| Freight absorbed | $30,000 | $0 (customer pays freight) |
| Returns handling | $5,000 | $1,000 |
| EDI chargebacks | $0 | $2,000 |
| Total cost to serve | $51,200 | $5,250 |
| Customer profit | $73,800 (about 14.8%) | $94,750 (about 19%) |
Customer A has the higher margin but is the less profitable account, by about $21,000 a year. The per-order costs here are illustrative; use your own.
How to Measure Customer Profitability
- Start with revenue and product cost by customer, using landed cost, not just purchase price. See landed cost tracking.
- Subtract rebates, allowances, and special pricing given.
- Estimate a cost per order, per line, and per shipment from your operating costs.
- Add freight paid, returns handling, chargebacks, and commissions by customer.
- Rank customers by profit and profit margin, not by revenue.
You do not need perfect activity costing to start. Reasonable estimates per order and per line, applied consistently, already change the conversation.
Segmenting Customers by Profitability
Plot customers by revenue and profit margin:
- High revenue, high margin: protect and grow
- High revenue, low margin: fix the cost to serve or the pricing
- Low revenue, high margin: grow, often with little extra cost
- Low revenue, low margin: move to lower-cost service, or reprice
What to Do With Unprofitable Accounts
- Minimum order values, or a small-order fee
- Freight policies that match the account’s ordering pattern. See freight management for distributors.
- Move ordering to EDI or a portal, which cuts processing cost. See customer portal strategy.
- Review special pricing and rebates against the account’s real profit. See managing customer-specific pricing.
- Tighten terms for slow payers. See credit management best practices.
- Service tiers: match service levels to account value.
The Data You Need
Customer profitability is only practical when orders, shipments, freight, returns, rebates, and costs live in one system, by customer. When they are spread across shipping software, spreadsheets, and accounting, the analysis becomes an annual project that nobody trusts. See why distributors lose money on their fastest-moving products.
See Bizowie in Action
Real screens from Bizowie, not mockups. Click any screen to enlarge.
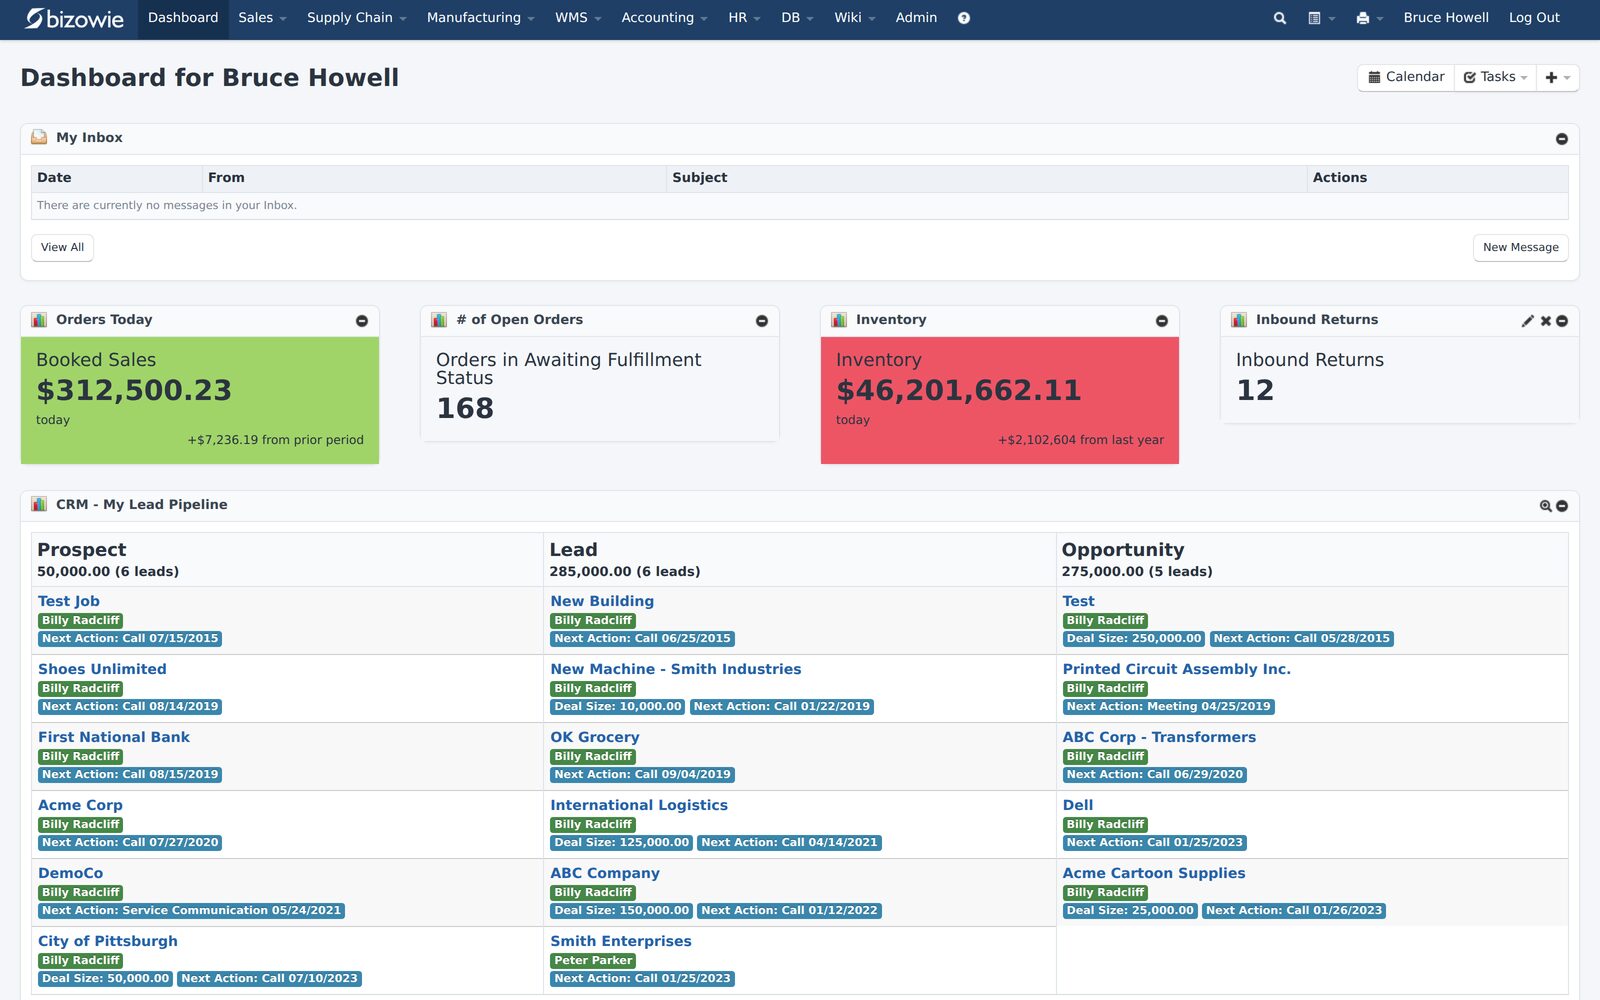
Bookings, open orders awaiting fulfillment, and inventory value at a glance.
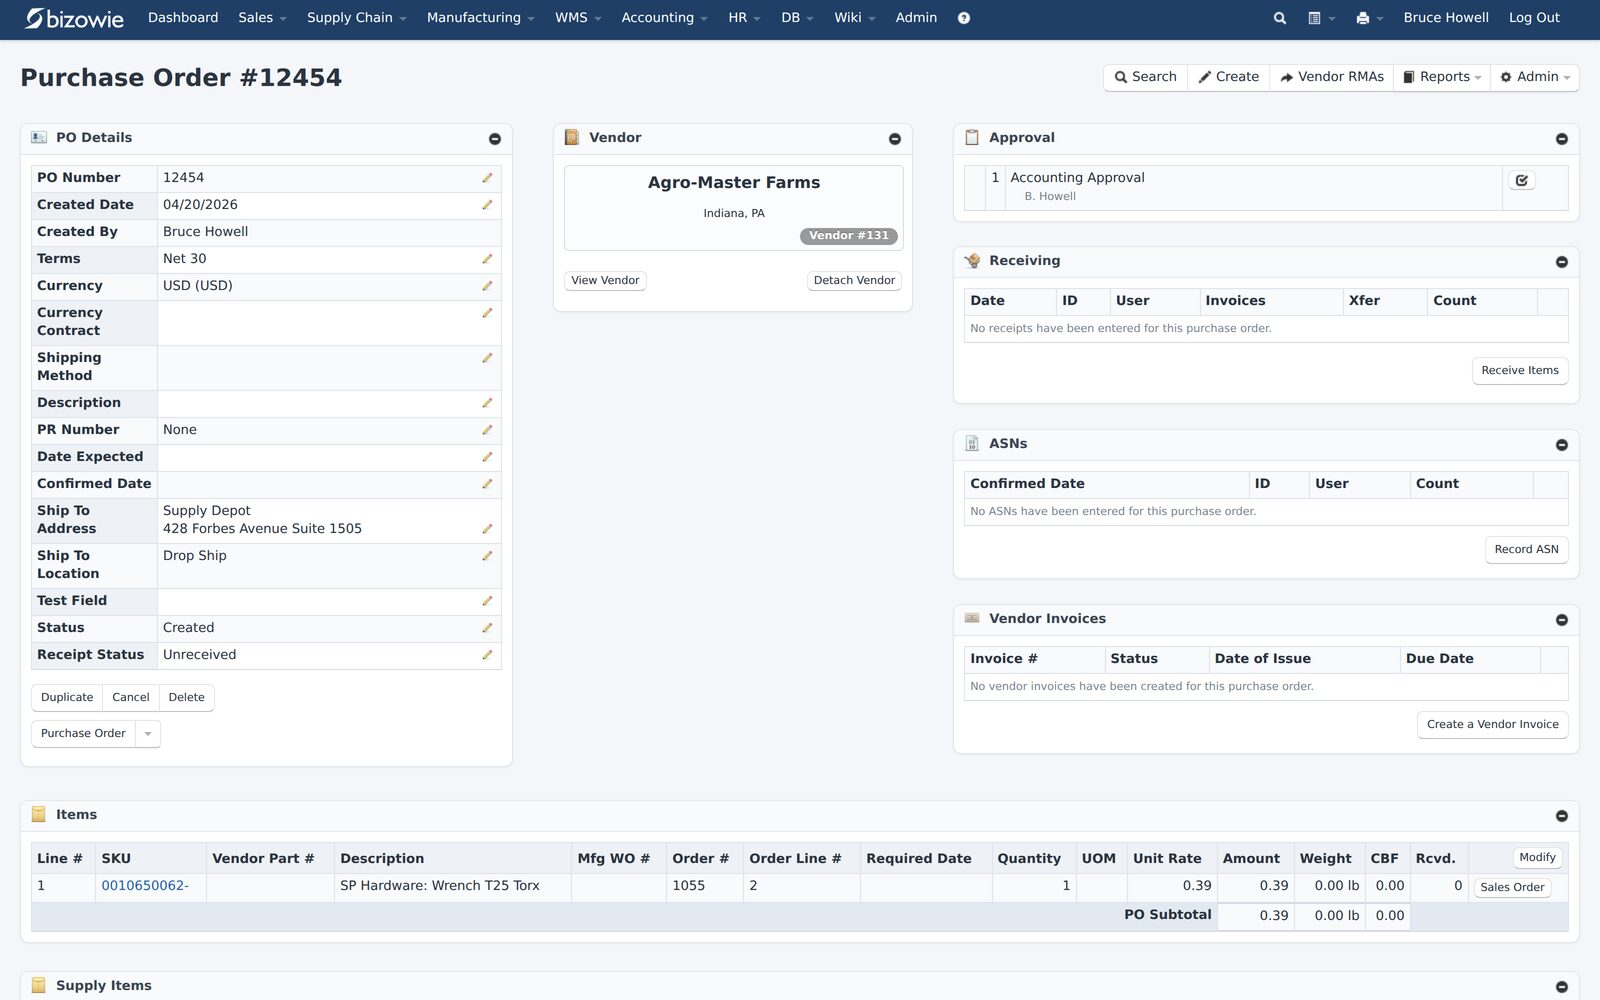
Purchase orders with approvals, receiving, ASNs, and vendor invoices on one screen.
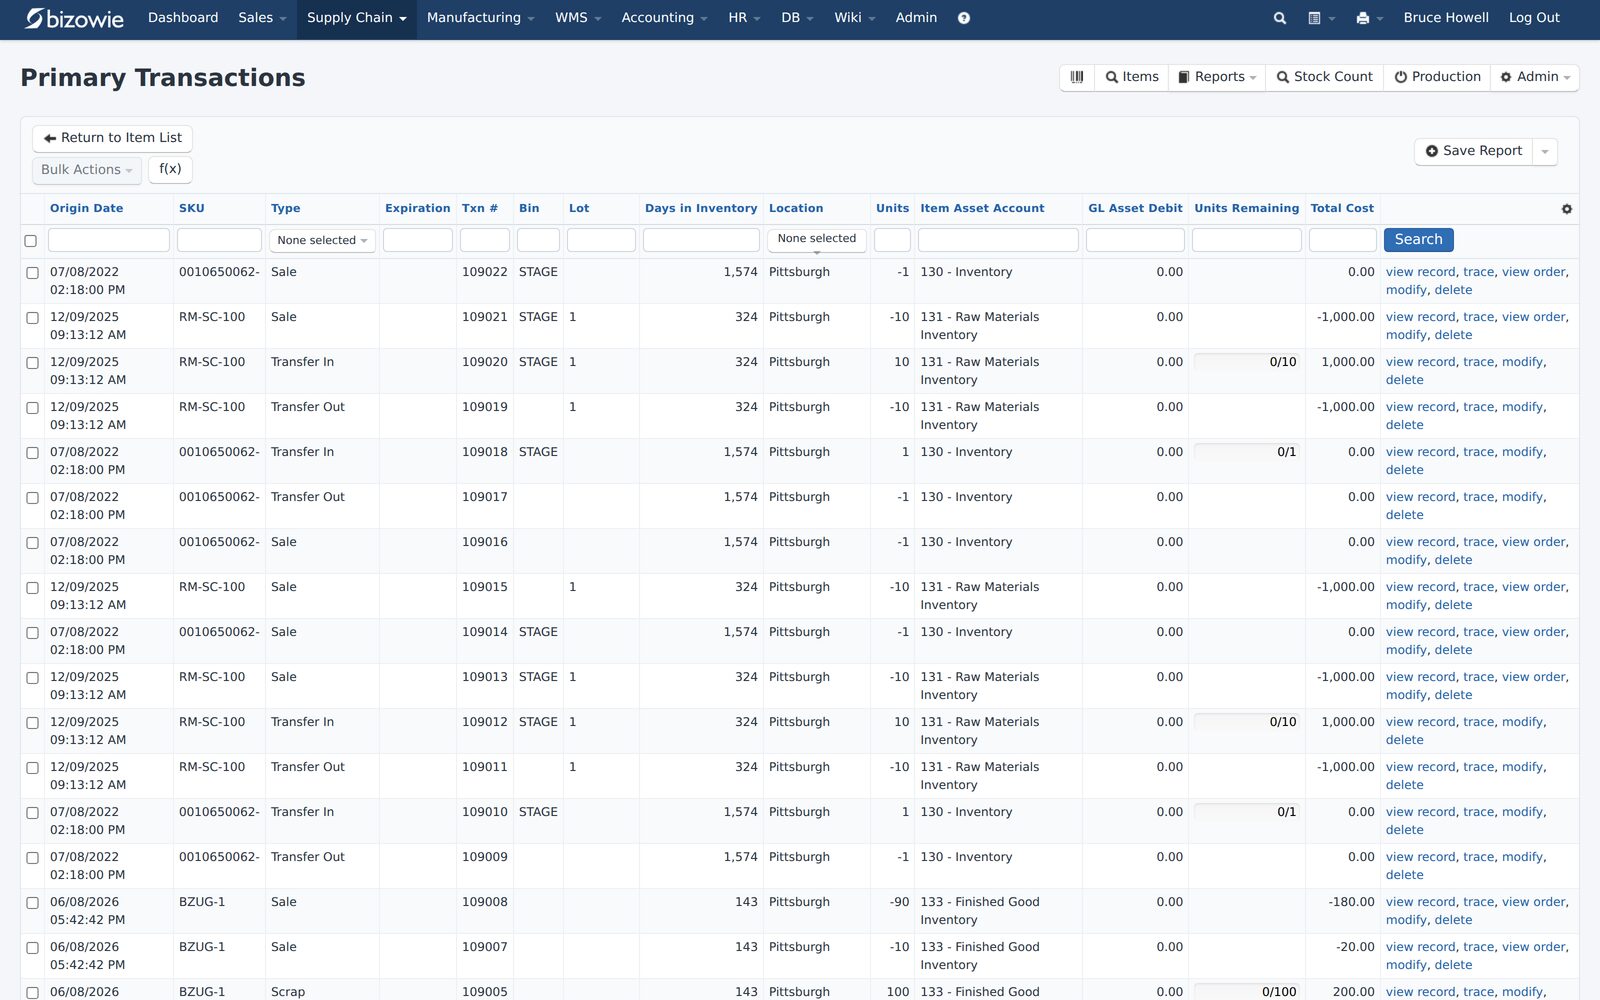
Every receipt, transfer, build, and quarantine move by SKU, lot, bin, and location.
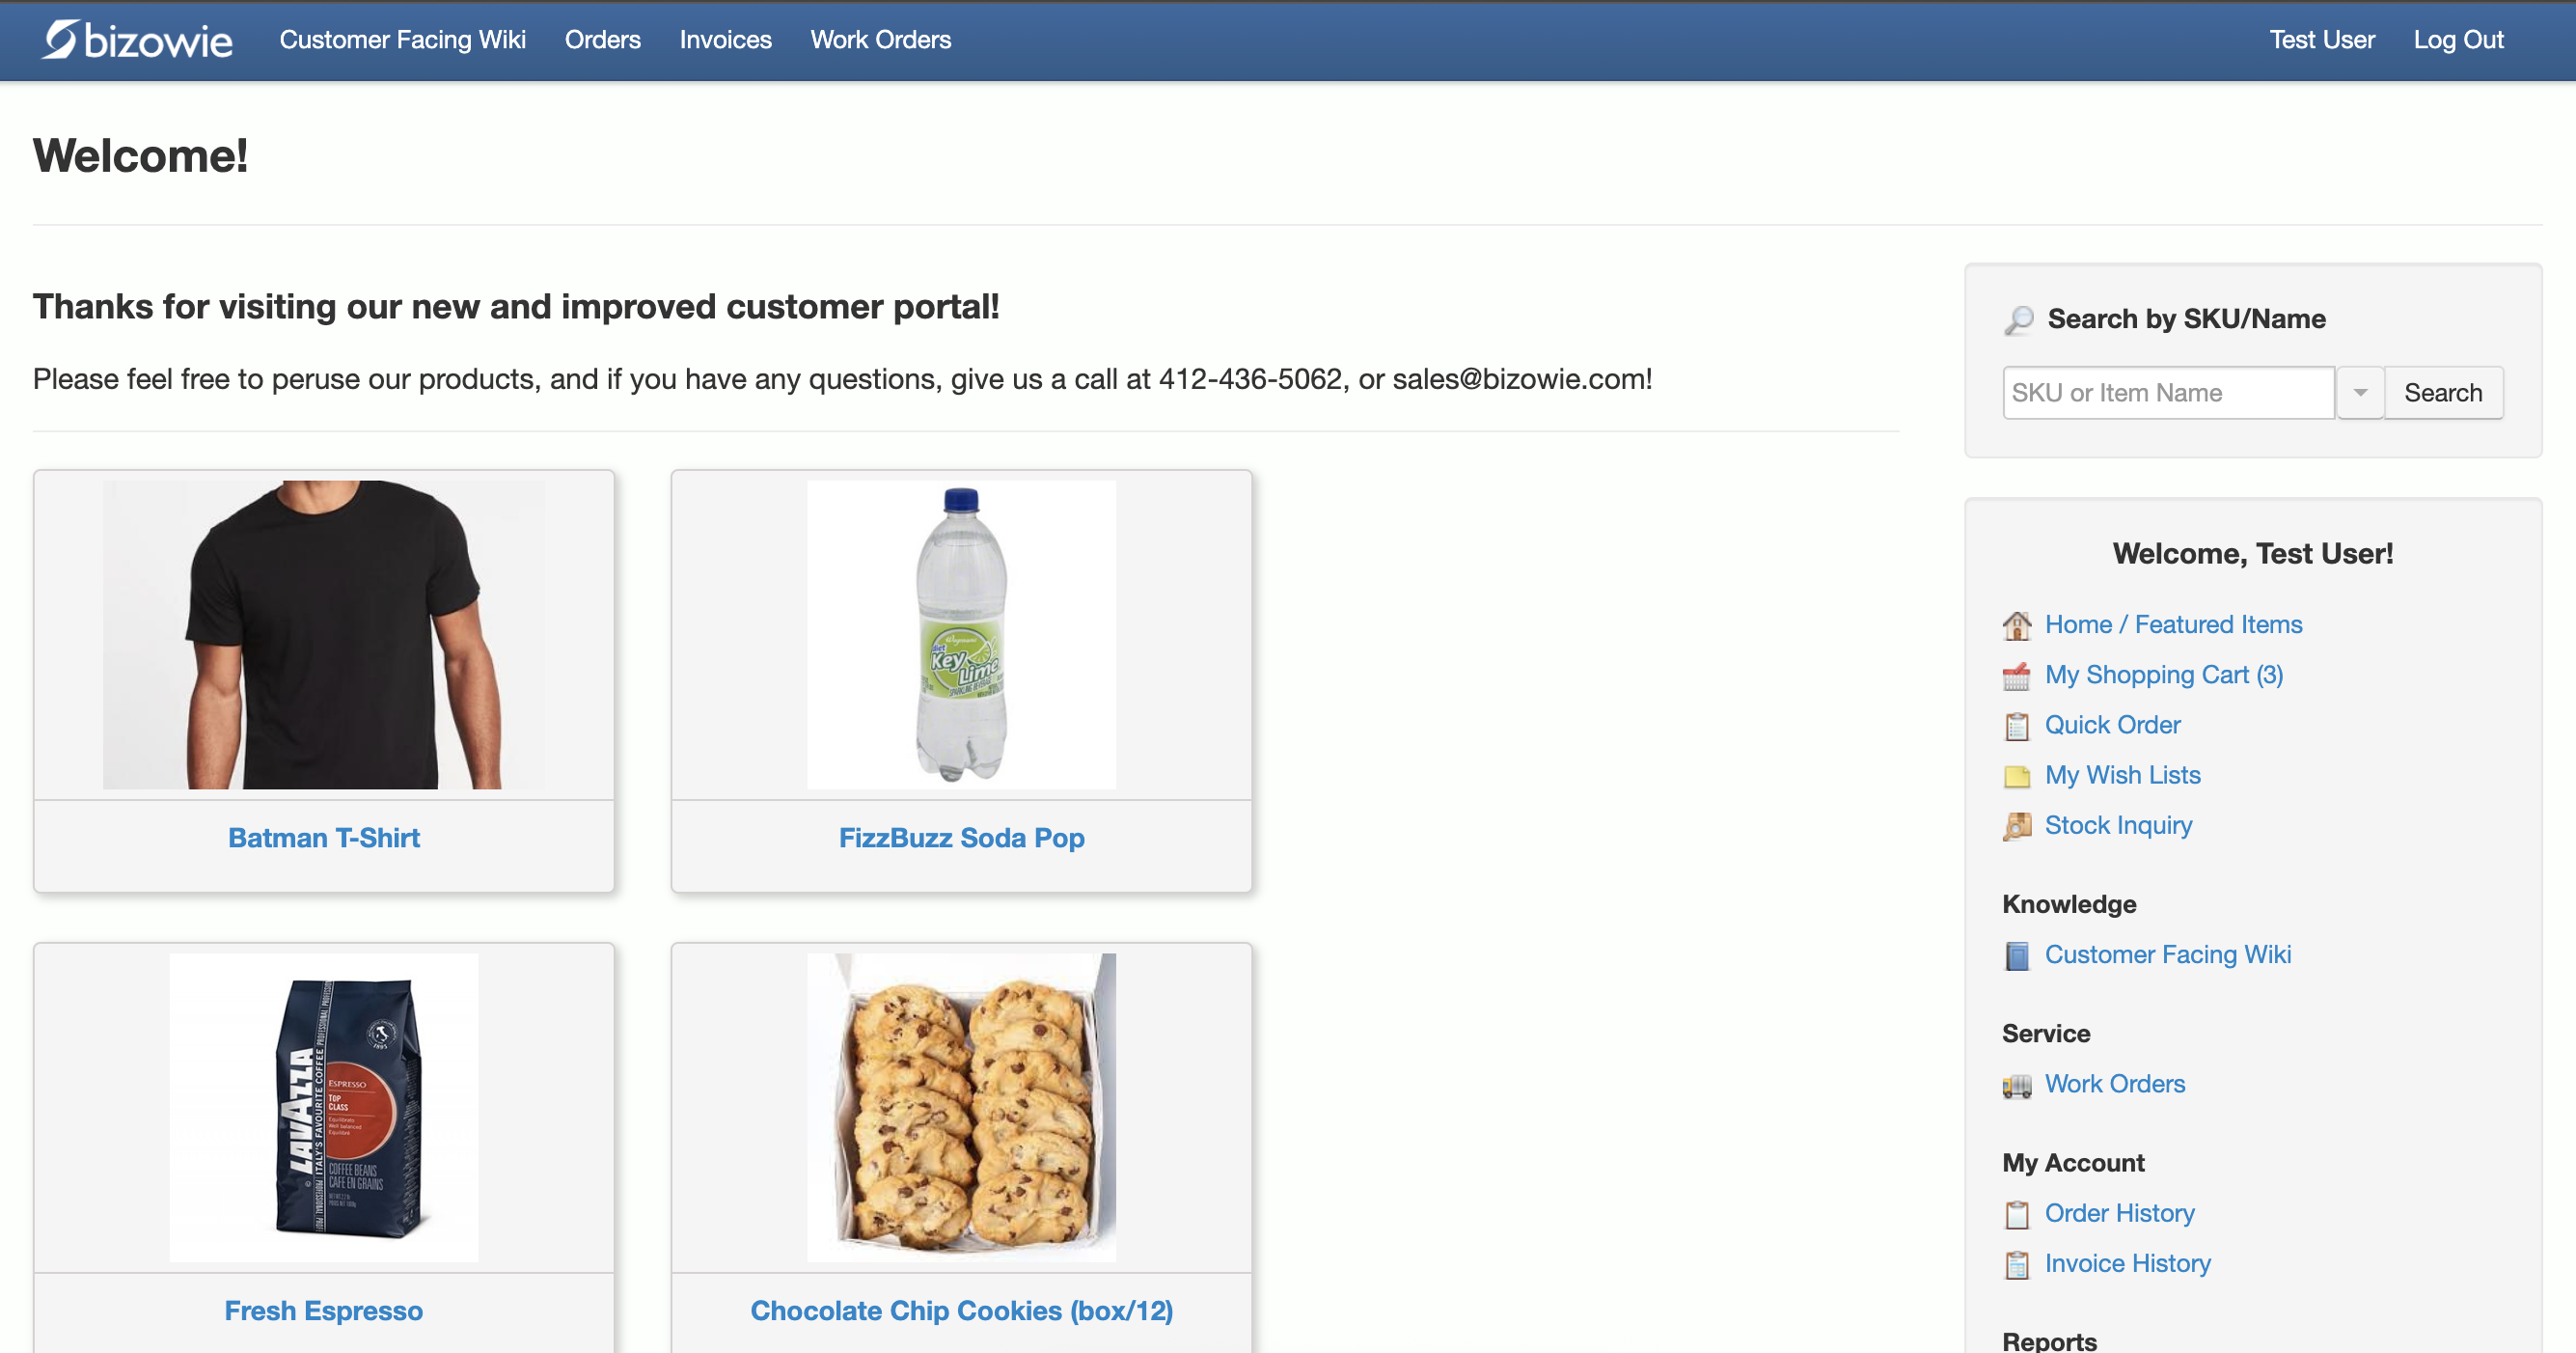
Customers search items, place orders, and check order and invoice history themselves.
Customer Profitability in Bizowie
Bizowie shows profitability at any level: job, product, product line, customer, and sales rep. Customer-specific, volume-tiered, and contract-based pricing is managed in the same platform, along with direct, indirect, and landed costs, so margins reflect the cost after shipping and commissions. Orders arrive by EDI, ecommerce, and a B2B portal as well as through your team, shipments record carrier, weight, and freight details, and commission tracking and dimensional financial reporting are built in. See why your ERP should include commission tracking.
“We have seen immediate economic benefit for our business in terms of productivity from our warehouse staff, eliminated processing errors, and better stock control.”
Julius Hart — Managing Director, LensesOnline
Frequently Asked Questions
What is cost to serve?
The total cost of serving a customer beyond the product itself: order processing, handling, freight, returns, pricing concessions, compliance costs, sales effort, and payment terms.
How do you calculate customer profitability?
Start with gross margin by customer using landed cost, subtract rebates and allowances, then subtract estimated costs per order, line, and shipment, plus freight, returns, chargebacks, and commissions.
Why is my biggest customer not my most profitable?
Large accounts often receive the best pricing, the most service, and the most concessions. Their cost to serve can outweigh their volume.
Bring Us Your Customer List
Tell us which accounts you are unsure about. We’ll show you how Bizowie would show their true profitability, and if we are not the right fit, we will tell you.
See how Bizowie would show your customer profitability
Tell us a little about your operation and we’ll reply with an honest assessment of fit, not a sales pitch.
- A real person reviews your submission and replies within one business day.
- No automated email sequences.
- If we’re not the right fit, we’ll tell you.
Prefer to talk?
Call (888) 635-2517, Mon–Fri, 9 AM–5 PM Eastern